Your team puts real time into every vehicle page: photos, video, a 360 spin, a proper description, finance quotes, labels. Buyers want more detail, not less. In a Cazoo survey of 2,025 used car buyers, reported by Car Dealer, 61% said they want full vehicle history reports readily available. But which of that effort actually pays back in enquiries on your site?
We didn't know either. So we built a report to find out.
Every dealer has a theory
Ask ten dealers what makes a vehicle page work and you'll get ten answers. Video sells cars. Forty photos beat twenty. A price drop label gets the clicks. Some of those are probably right and some probably aren't. Until now, nobody on our platform could say which.
The obvious way to check is also the wrong one. Compare vehicles with video against vehicles without, and you'll often see a difference. But the cars with video tend to be different cars: newer stock, a certain price band, a certain brand. A fresh, well priced car gets more enquiries whatever is on its page. A simple comparison mixes all of that together.
A simple comparison can hand you a confident answer that is completely backwards.
Comparing like with like
The vehicle data impact report, now rolling out on Autonomy, only ever compares a vehicle with similar vehicles on the same site: the same vehicle type, new or used, a similar price for that site and a similar time in stock. It then combines those matched comparisons into one answer.
For each piece of vehicle data, it measures leads per 1,000 views and leads per day a vehicle is live, for vehicles that have it and vehicles that don't. You choose what counts as a lead (enquiries, reservations, deals or all three) and filter by date, vehicle type, and new or used.
Each one gets a plain verdict:
- Helps: vehicles with it are associated with more leads.
- No clear effect: there's no difference we can stand behind.
- Fewer leads: vehicles with it are associated with fewer leads.
- Not enough data: we won't guess.
The wording is deliberate. The report says "associated with", never "causes". It's an honest read of your own data, not a promise.
What it looks at
The report covers the vehicle data your team controls:
- the main image, and whether a vehicle has enough images
- video and 360 spins
- the attention grabber and vehicle labels
- monthly finance prices
- price drops
- key features, the description, standard equipment and technical specs
It also knows when something can't apply. Finance on farm machinery, or labels on a site that hides them, won't count against a vehicle. Anything your site doesn't show is listed separately rather than scored.
From report to action
A finding is only useful if you can act on it. Next to each piece of data, the report shows how many live vehicles are missing it, and that number links straight to those vehicles in the admin. If video helps on your site and 40 of your cars don't have it, you know exactly where to point your team tomorrow morning.
It goes a step further for vehicles that gain data. When a car gets a video or a better description, the report compares its leads in the 14 days before and after, adjusted for whatever the rest of the site was doing in the same weeks. For photos and key features, it shows how leads change as the count goes up, so you can see where adding more stops being worth the effort.
Built to be honest
We were strict about what the report won't do. Spam enquiries are stripped out. Days when a vehicle's data changed are left out of the main comparison, so a half finished update doesn't muddy the result. A smaller site, or a short date range, will see "not enough data" rather than an answer it hasn't earned.
The data also has to exist before it can be compared. The report builds its history day by day from the moment it's switched on, so the sooner a site starts, the sooner it has answers.
Getting started
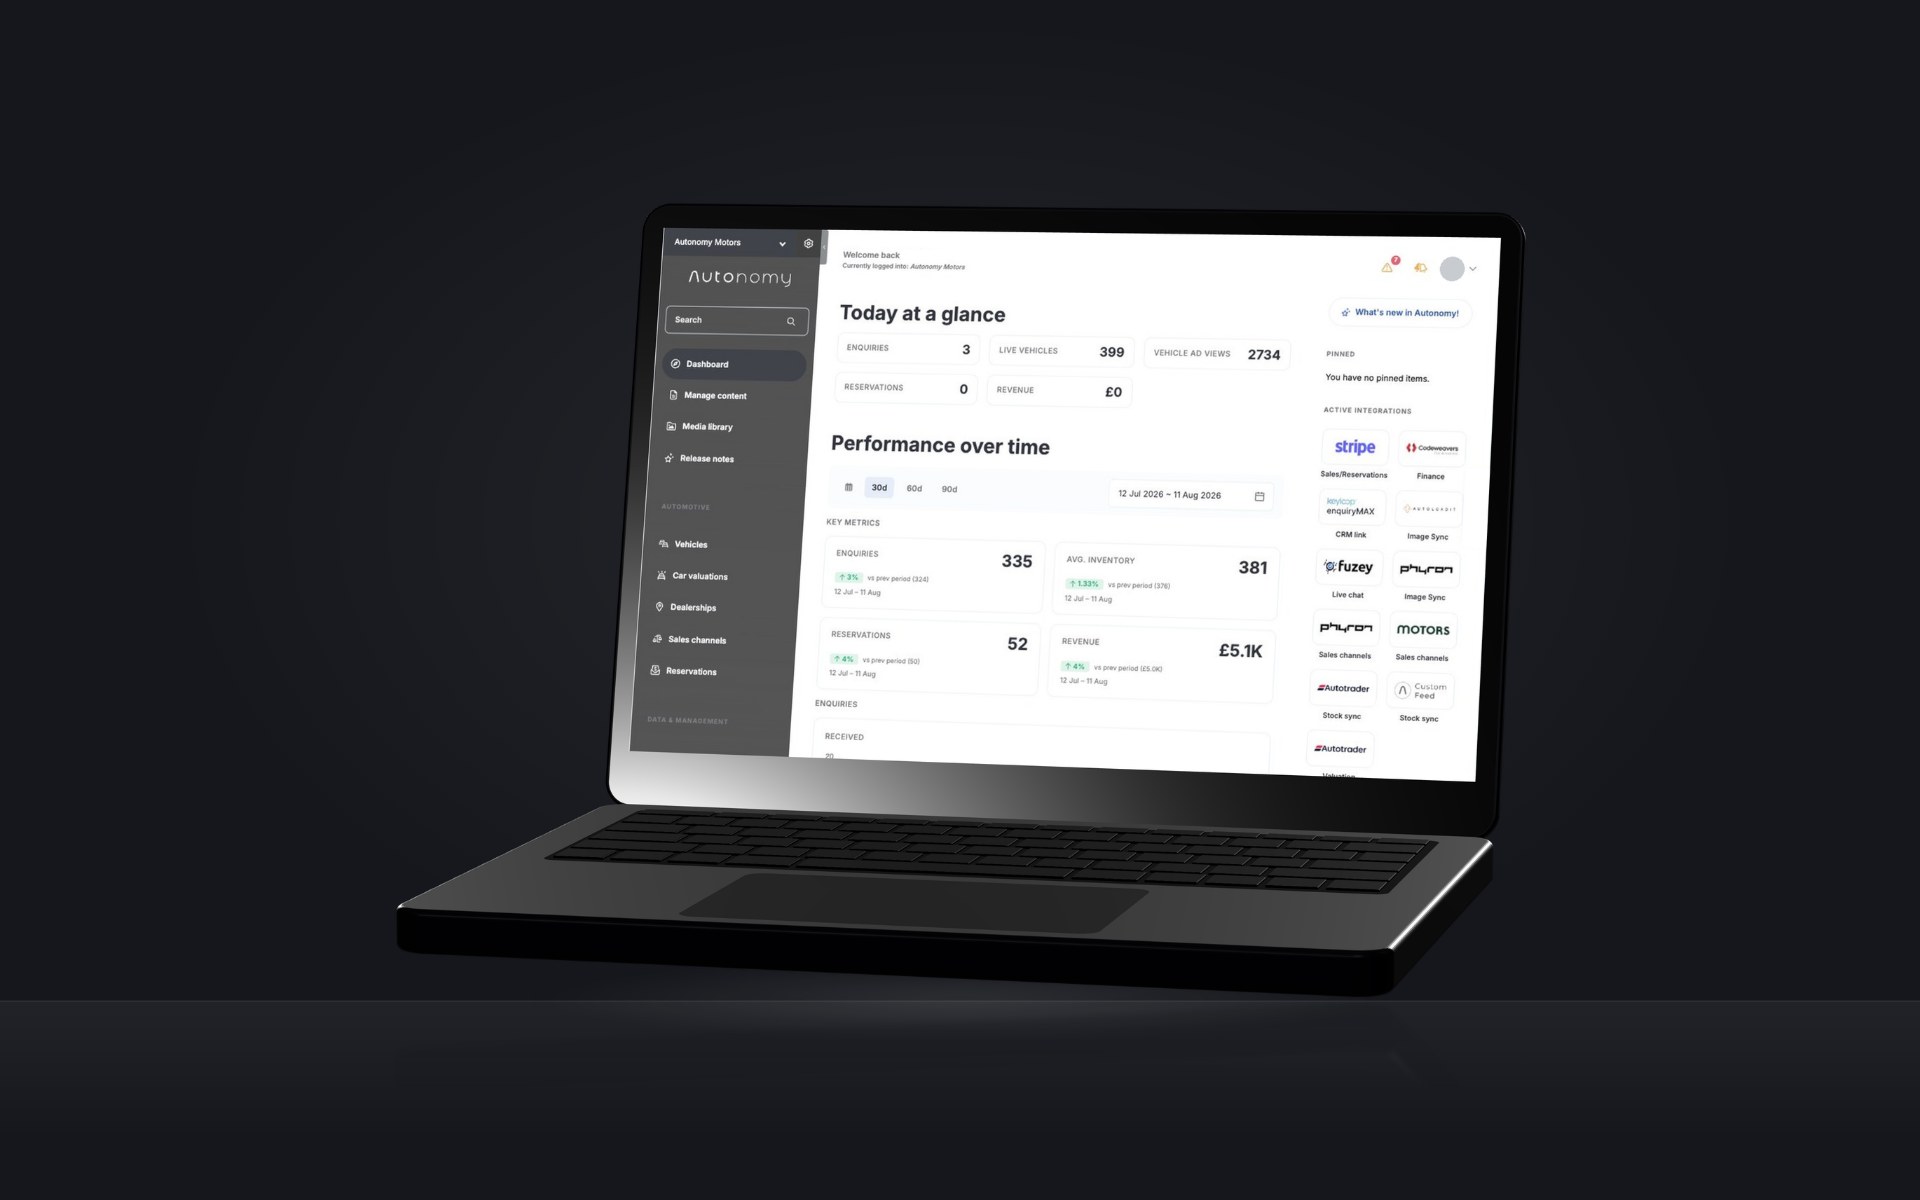
The vehicle data impact report is rolling out to Autonomy sites now. If you'd like it switched on for your site, or want to see what it could tell you, speak to the team.