Every vehicle on your forecourt is money waiting to come back. Most dealer groups can tell you how much stock they hold today. Far fewer can say, without a spreadsheet and an afternoon, how quickly it actually sells, or how much of it has been sitting there for more than 90 days.
That's the question our new stock turnover report answers.
A stock count doesn't show speed
Autonomy's vehicle reports already show what you hold right now: stock by body type, fuel, make, year and price band, and how each vehicle performs on your website in views, enquiries and reservations. That's useful, but it's a snapshot. It tells you what's on the forecourt, not how fast it leaves.
Speed is where the money is. A car that sells in three weeks and a car that sells in three months look identical in a stock count. They don't look identical in your cash flow.
A stock count tells you what you hold. Turnover tells you what it's costing you.
New in Autonomy: stock turnover
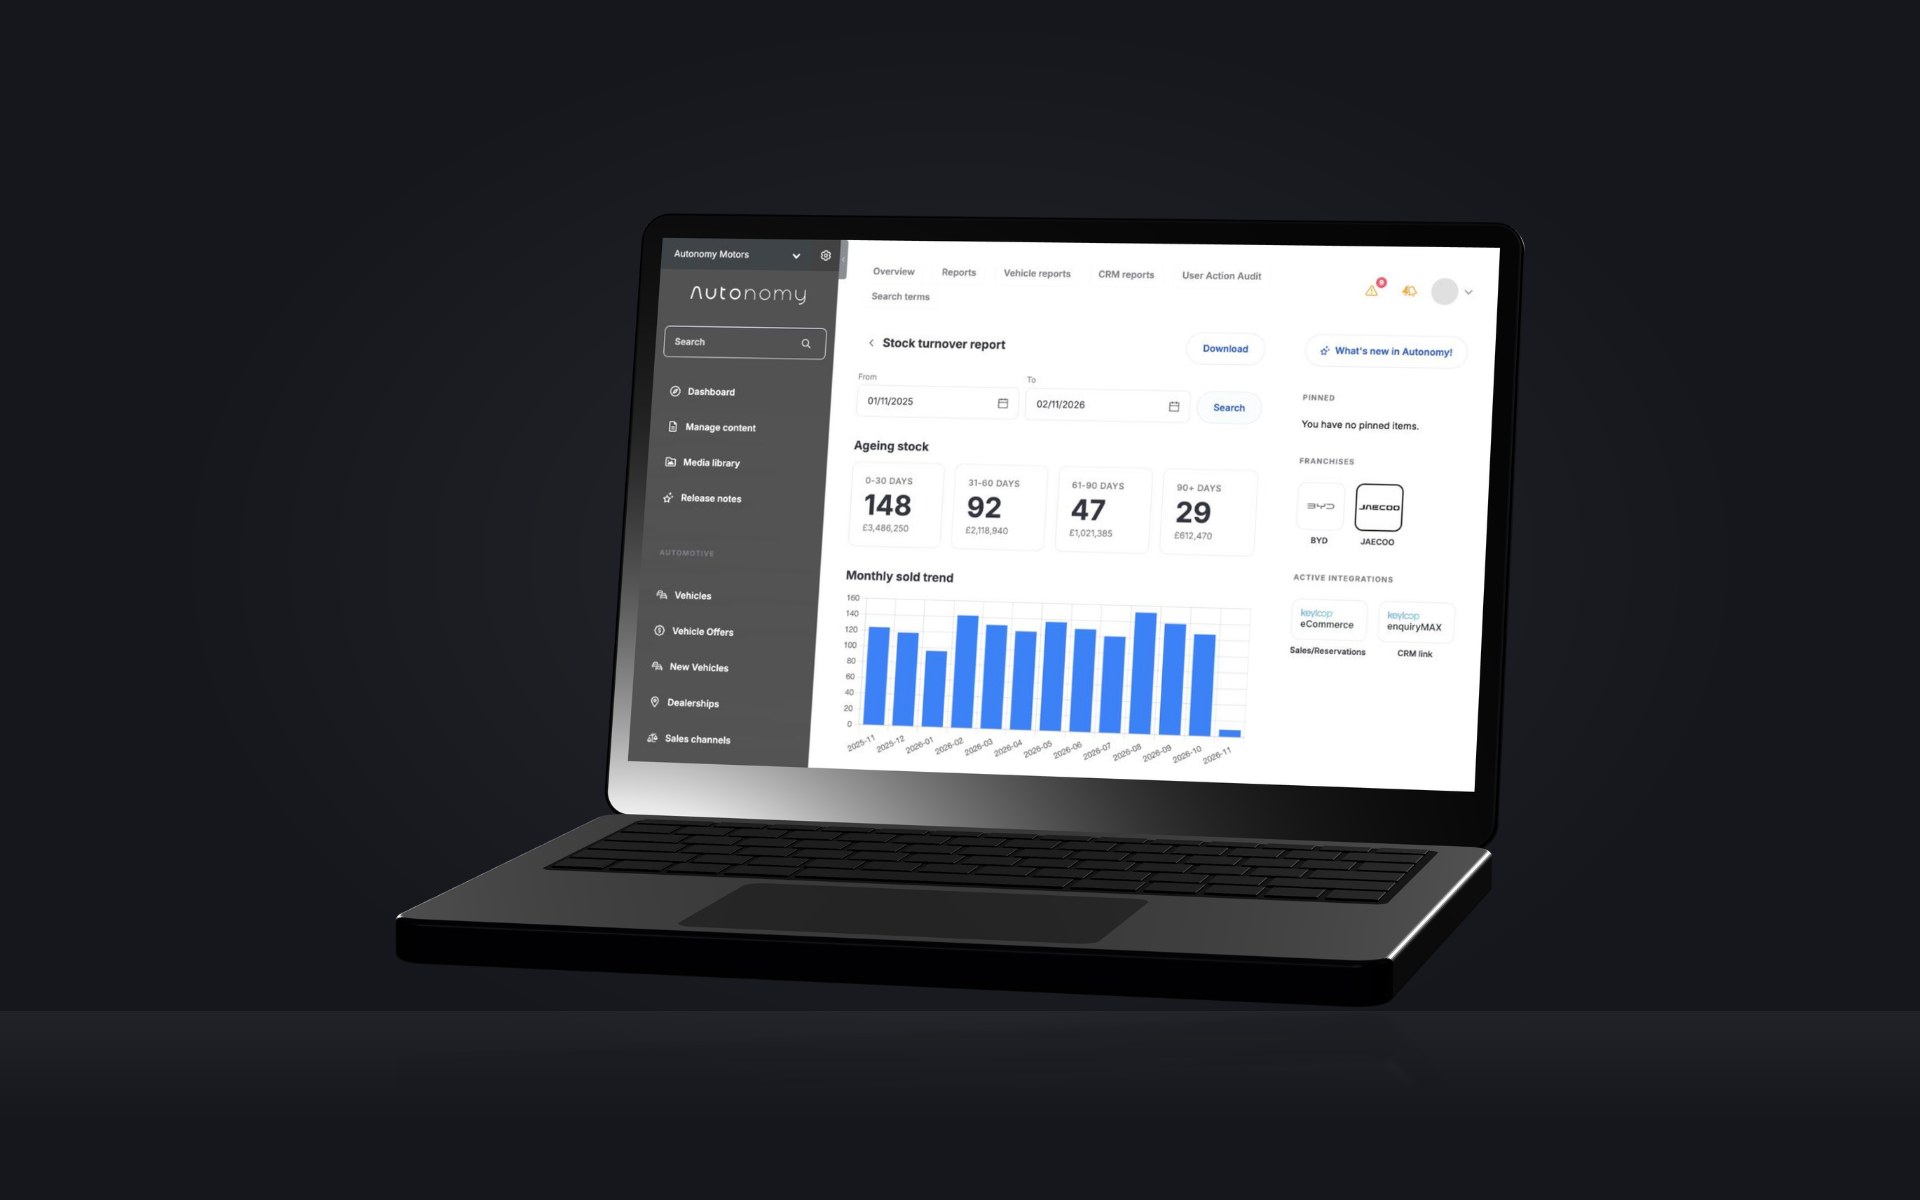
The stock turnover report sits in Reporting, under Vehicle reports. It reads the dates Autonomy already keeps against every vehicle: when it arrived in stock, when it was reserved and when it sold. There's no extra data for your team to enter.
You can filter by date range, by new, used or demo, by dealership and by whether a vehicle is published, so a group can look across every site or zoom in on one.
How quickly each part of your stock sells
For vehicles you've sold, the report shows days to sell. You get the median, plus the quickest and slowest quarter, so one car that went in a day or one that lingered all summer doesn't skew the picture.
Slice it by make and model, by price band, by new, used or demo, and by dealership. A monthly sold count sits alongside, so you can see whether things are speeding up or slowing down across the period you've picked.
What's ageing, and what it's worth
For stock you still hold, the report splits every vehicle into four age bands: 0 to 30 days, 31 to 60, 61 to 90, and over 90. Each band shows how many vehicles are in it and their total value.
That turns "we've got some old stock" into a number your board can act on: how much capital is sitting in cars that have been with you for more than three months, and which site it's on.
Sold against still in stock
The report also puts the stock you've sold side by side with the stock you still hold, on the same make, model, price band and dealership splits. Where a segment is selling well but you're still holding plenty of it, or where stock is piling up in a band that isn't moving, it stands out in one view rather than in a month end spreadsheet.
Built to be straight with you
Numbers are only useful if you trust them. Vehicles marked as sold without a sale date, typically older stock from before that date was recorded, are left out of every timing figure and shown separately as "sale date unknown", rather than quietly pulling the averages around. The age bands add up to your published stock count, so the totals reconcile.
Every view exports to CSV or Excel for your stock meeting or your board pack.
Getting started
The stock turnover report is in Reporting on Autonomy now. It works hand in hand with our vehicle data impact report: one shows which vehicle data wins enquiries, the other shows how quickly your stock turns into sales.
If you'd like a walk through it on your own stock, speak to the team.